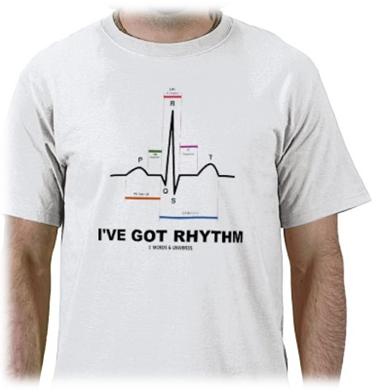
with a good understanding of electrocardiograms (ECGs) , you’ll be able to diagnose a wide range of heart problems,
an ECG waveform helps you in monitoring the patients condition and if necessary , begin lifesaving interventions ..
To Build up basic ECG skills , you should begin first with an overview of the heart’s anatomy & physiology .
these posts could help 🙂 :
https://www.phartoonz.com/2010/09/02/electrical-conduction-system-of-the-heart/
https://www.phartoonz.com/2010/09/10/electrophysiology-phases-of-the-cardiac-cycle/
=============
=======
Placement of ECG Electrodes :
– Standard leads –
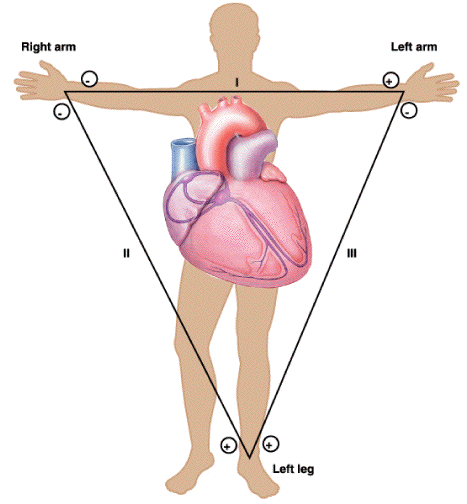
There are three of these leads, I, II and III.
Lead I : between the right arm (-ve) and left arm (+ve electrode) .
Lead II : between the right arm (-ve) and left leg (+ve electrode) .
Lead III : between the left arm (-ve) and left leg (+ve electrode) .
” to memorize the electrodes position easily , remember the left leg is always positive ,
and if there are no legs ( as lead I ) : the left arm would do the job “
*
*
*
– Chest Electrode Placement –
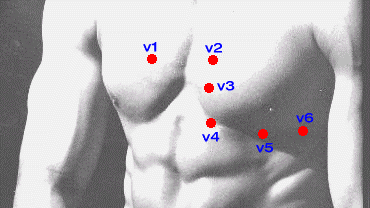
V1 : Fourth intercostal space to the right of the sternum.
V2 : Fourth intercostal space to the Left of the sternum.
V3 : Directly between leads V2 and V4.
V4 : Fifth intercostal space at midclavicular line.
V5 : Level with V4 at left anterior axillary line.
V6 : Level with V5 at left mid axillary line. (Directly under the midpoint of the armpit)
Hint : Before placing the electrodes , Clean the skin with an alcohol wipe if necessary and you could shave the electrode areas If the patient is very hairy .

Each Heart Beat is composed of Four actions
1- Atrial Contraction
2- Atrial Relaxation
3- Ventricular Contraction
4- Ventricular Relaxation
the ECG detects Only 3 of these action , But before talking about them .. we should know that the ECG doesn’t measure the contraction & relaxation or what we can call the muscular property of the heart
it deals with the electrical properties ” that’s why it’s called Electro ! “,
these electric properties are : depolarization ( by which we detect cardiac contraction ) & Repolarization ( by which we detect cardiac relaxation )
OK 🙂 ….
back to the ECG chart .. as i said it shows three of the heart activities :
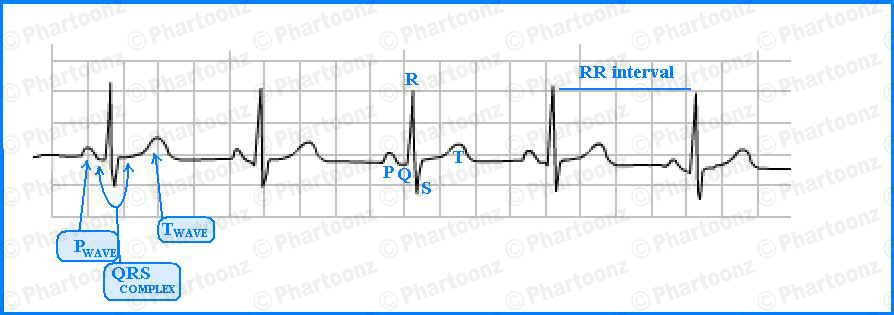
![]() P wave : represents the depolarization & contraction of the atria………………….
P wave : represents the depolarization & contraction of the atria………………….
![]()
![]() QRS complex : represents the depolarization & contraction of the ventricles
QRS complex : represents the depolarization & contraction of the ventricles
![]()
![]()
![]() T wave : represents the repolarization & relaxation of the ventricles……..
T wave : represents the repolarization & relaxation of the ventricles……..
Hint : Sometimes a small positive U wave may be seen following the T wave , This wave represents the last remnants of ventricular repolarization .. Inverted or prominent U waves indicates underlying pathology or conditions affecting repolarization
so , the missing action that isnt recorded is … ?
Right ! ….. Atrial Repolarization
it’s not recorded on the ECG chart because it happens at the same time as ventricular depolarization which gives much stronger signal that is enough to make the Atrial repolarization obscured .
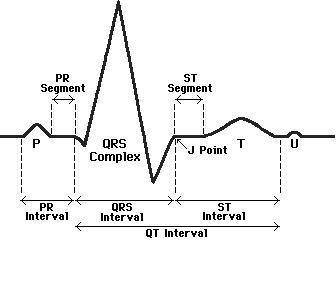 Done with the waves .. lets move on to the Various intervals :
PR interval : represents the conduction time between the atria & ventricles
===========
QRS interval : indicates the time taken by the impulse to spread through the 2 ventricles
===========
QT interval : represents the total electrical activity of the ventricles “de&re-polarization”
===========
RR interval : indicates the rate of ventricular contractions and using it we can detect the Heart rate .
===========
PP interval : indicates the rate of atrial contraction
Hint : In normal circumstances PP & RR intervals are both equal .

A normal healthy individual usually has an ECG chart as the following :
look carefully and memorize the regular PQRST shape
Heart Rate Normally should be between 60 – 100 Beats\min
Now … have a look on the most common abnormalities & always compare them to the Normal sinus Rhythm ↑
![]()
>> Bradycardia <<
the Heart Beats are slow ,
You can notice that easily because the distance between the beats is kind of long meaning that the heart takes longer time to initiate the next beat
( Hint : the easiest way to measure the distance between the heart beats is through the top of the R waves )
![]()
>>>> Tachycardia <<<<
Fast heart rate , the heart takes short amount of time to initiate a new beat and so the distance between the beats is small
![]()
>> Atrial Fibrillation <<
some of the heart fibers go out of control and start acting as independent pacemakers , they generate their own electricity …
small numerous extra P waves are detected in the ECG chart
![]()
>> Atrial flutter <<
the independent fibers realized that they are weak alone and strong when they stick together
so , each group of fibers started working together as a single pacemaker generating stronger electricity
bigger -but fewer- extra P waves are detected in the ECG chart
![]()
× First degree AV Block ×
What happens is …
the signal take long time to be transmitted from the atria to the ventricles & the conduction efficacy is weaken
the PR wave is elongated in the ECG chart
![]()
x× Second degree AV Block ×x
the conduction is getting more and more weaker than the 1st degree
even sometimes the signal doesn’t reach the ventricles at all
Some lonely P waves with no QRST respond appear in the ECG chart
Hint : these P waves have Normal shape ( not small or big as in atrial fibrillation & flutter )
![]()
Xx× Third degree AV Block ×xX
The conduction collapses & the electric signals created in the atria can not reach the ventricles at all ..
Now the ventricles use their brains and try to deal with this critical situation !
Purkinje fibers and AV node start working as independent pace makers because the SA node has no control on them any more .
abnormal QRS waves are detected .. the T wave becomes upside down ![]()
![]()
>> Premature Ventricular Complex <<
In this case , the SA node has full control and the Conduction is good too
But the ventricles go crazy & develop independent contraction every once in a while
Few abnormal QRS waves with upside down T waves are detected in the ECG chart , but the rest of the beats are Normal
![]()
>> Ventricular Tachycardia <<
No P waves at all , & the Ventricles are giving powerful fast contractions on their own !
![]()
>> Ventricular Fibrillation <<
That’s the most dangerous case , and could be fatal ..
the ventricles are shaking like a jello and No Blood in pumped to supply the body .
![]()
& Now we are Done ^_^
here is something cool you can do : ” an ECG Dance ” ! … watch this video :biggrin: :
you can add these moves in your workout routine (Don’t miss performing in front of a mirror :happy: )
in 3 or 4 sessions you’ll master all these abnormalities , Burn some calories & loudly Laugh at your self too 😀
 for further reading , here is a very Good book that can help :
Remember >>> Practice makes Perfect 😉
——-
References:
– ECG interpretation , by : Lippincott Williams & Wilkins
– ECG interpretation made incredibly easy , 4th edition



5 stars post :happy:
Great Work
Thank you so much ^_^
nice article, keep the posts coming
I’ll have to go back and read all your previous posts now.
Thank you all 🙂
stick around :happy:
a great effort
a very nice idea good work
congeratulation 😆
Thank you so much :happy:
:heart: for ever Welcome :heart:
Great work.
Really appreciate its simplicity
Great work… very helpful.
very well explained easy to understand thnkx…..:)
Very nicely explained. Thank you. Keep doing.
Very helpful…without making much complicated…..
person after 45 must have knowledge of body– just in banks KYC, KYB( know your body)
ECG is becoming very common word during patients.
Brilliant post about understanding ECG charts.
Thank you